
“The efforts of not only the members of the Pasadena Police Department, various non-profit and community organizations have significantly contributed to the decrease in crime over the years,” said Interim Police Chief Cheryl Moody.
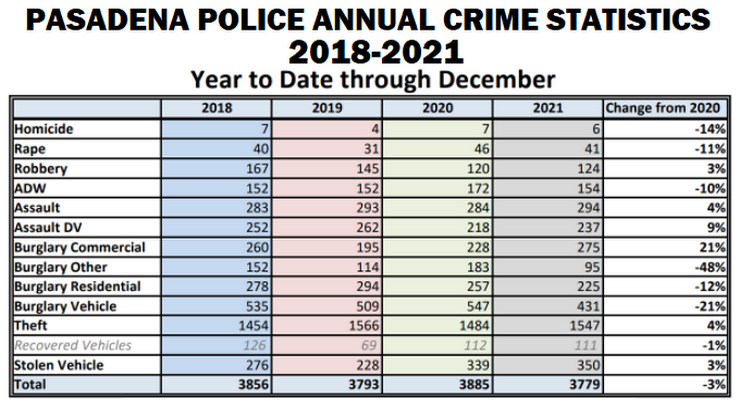
Through crime decreased in many crime categories, including homicide, rape and assault with a deadly weapon, as well as residential and vehicle burglary, commercial burglary increased b y 21 percent and theft increased by 4 percent. The PPD reports that residential burglary decreased by 12 percent; other burglary decreased by 48 percent; and vehicle burglary decreased by 21 percent. It is important to remember that Pasadena’s crime statistical report is based on Calls for Service and may not be compliant with Uniform Crime Report statistic recording.
In comparison, the Los Angeles County Sheriff’s Department (LASD) reports that homicides increased in many LASD-patrolled areas. The City of Los Angele Mayor’s Office also reports that the city has been seeing an increase in violent crime, not uncommon in large metropolitan cities since the start of the Covid-19 pandemic.
Is Pasadena Safe?
According to cityrating.com’s crime statistics The city violent crime rate for Pasadena in 2019 was higher than the average national violent crime rate by 13.85 percent and the city property crime rate in Pasadena was lower than the national property crime rate average by 4.28 percent. (Violent crimes are classified as murder, rape, robbery, and assault (crimes to persons). Property crimes are classified as burglary, theft, and vehicle theft.)
Overall, Pasadena’s crime looks to be in a downward trend with both violent crime and property crime decreasing. Based on this trend, the 2022 crime rate in Pasadena for 2022 is expected to continue to decrease and be lower than in 2019.
Crimegrade.org’s analytics shows that the rate of burglary in Pasadena is 4.3 per 1,000 residents during a typical year. Further, the organization reports that people who live in Pasadena generally consider the northeast part of the city to be the safer from burglary and less safe in west neighborhoods.
Considerations with Crime Statistics
Pasadena is a “destination city” – there is a “resident population” (those who live in the city boundaries) and a “non-resident population” (people who are not permanent residents of the city). So rates of crime may appear to be higher when there are more people in the area, such as during the day, or for large special events. We must also consider the zoning areas of the city; there is more retail and commercial business in the south of the city where the crime rate may be higher for certain crimes.
Crime rates do not always reflect the safety of the area for residents. Some areas appear to have high crime rates because of the larger number of people in the area, such as areas with lots of recreational areas. Crime rates could appear higher even for safer areas.
Overall, crime occurs wherever there are people whether or not they live there.
CMP Can Help Protect Your Home and Business
According to crimegrade.com a crime occurs on average every 84 minutes in Pasadena. We’re here to help you keep your home and business secure. From simple to complex security systems, security patrols and everything in between, we can help. Click and request a no-obligation quote today or call us at 888-788-0813. We look forward to discussing your security needs soon.

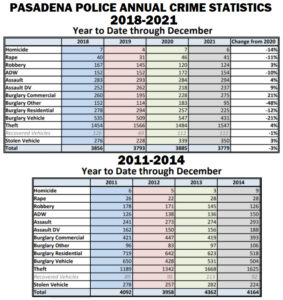
The Pasadena Police Department reports a significant decrease in crime from 2013, when the City had its highest crime rate this decade.
Note: Per the Pasadena Police Department website, “This Preliminary Monthly Statistical Report is based on Call for Service (CFS) data and is not Uniform Crime Report (UCR) compliant. Select call types are included for incidents closed with a report disposition. Using preliminary information allows for timely information to make immediate deployment decisions.”
Sources:
https://www.cityofpasadena.net/police/wp-content/uploads/sites/28/2021-12-December-Crime-Statistics.pdf?v=1641597460734
https://www.areavibes.com/pasadena-ca/crime/
https://www.neighborhoodscout.com/ca/pasadena/crime
https://www.cityrating.com/crime-statistics/california/pasadena.html
https://crimegrade.org/safest-places-in-pasadena-ca/
Photo credit: CityofPasadena.net